
One year ago I posted the first question. To this day I have posted 130 questions!

The question that has taken the longest time for me to create must be Question #89, if I include the baking as well. The question with the most published clues is Question #101 (I have not included the posted questions you to this day not have solved).
I have made some nice diagrams if you're curious. :) The first diagram shows the total points for each winner, how many clues the winners have needed and how many questions each competitor has won.

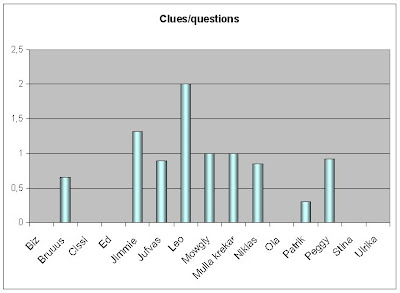
The next diagram shows the average amount of clues the winners have needed.
The last diagram shows the amount of months the competitors have won. Notice that the high score was introduced August 2007.

I also made this diagram; how many points each competitor has gained each month. But as you can see below, it's hard to interpret. I will try to fix this as soon as possible!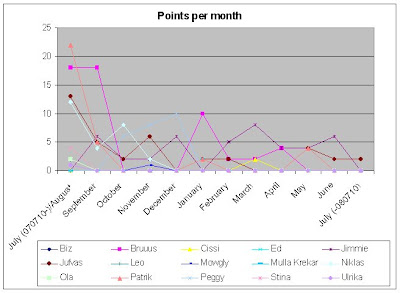


No comments:
Post a Comment